Remote Sensing in Geology
Geology is the fields of study concerned with the solid Earth. Included are sciences such as mineralogy, geodesy, and stratigraphy [1]. Although the definition refers the solid Earth as a subject with the development of space studies and sciences in recent years, geology becomes a broader topic and now include extraterrestrial life and planetary observation. As a result of this development remote sensing and geology began more interact. Especially hyperspectral imaging and SAR techniques helps geology on different situations and areas such as mapping, hazard prediction, detection of economic materials and so on.
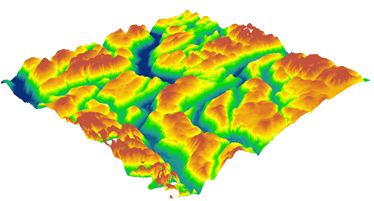
Figure 1. A representation of a Digital Elevation Model (DEM) (Source: https://gisgeography.com/).
Mapping
Mapping is a costly task both in terms of time and economy due to nature and transportation conditions, but it has become easy to map large areas according to various factors with remote sensing methods. Elevation and morphology map of an area can be obtained with remote sensing, especially hyperspectral imaging and LIDAR techniques. For example, a reflectance curve of quartz mineral can be seen in Figure 2.a. Reflectance curves are a signature specific to the rock type and are a distinguishing factor in determining the type. It also allows us to have an idea not only about the rock type but also the vegetation cover of the region. This situation can be observed in Figure 2.b.
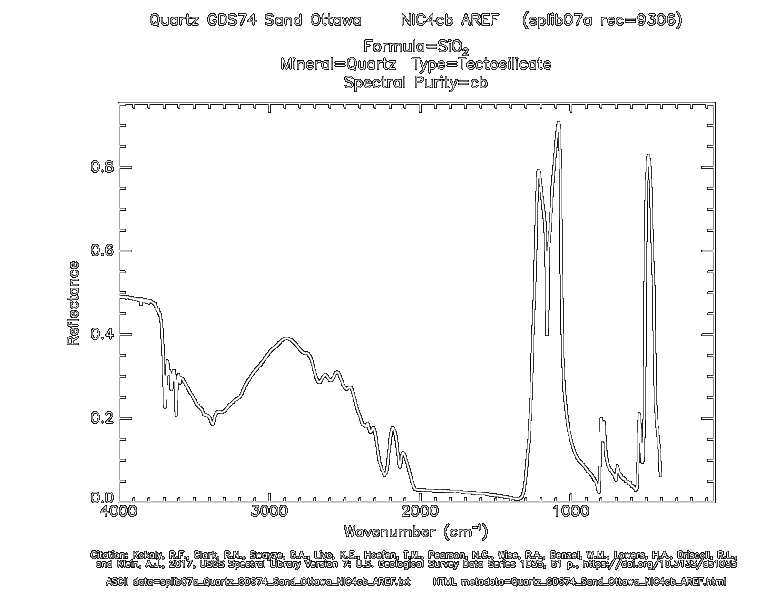
(a)
Source: https://doi.org/10.3133/ds1035
(b)
Source: https://doi.org/10.1109/JSTARS.2012.2194696
Satellites and/or aerial vehicles can be used at hyperspectral imaging. As an example, while some of airborne hyperspectral imagers are AVIRIS, HYDICE and AICA, Hyperion EO-1 and Chris Proba are satellite based hyperspectral imagers. While both of solutions suffers from atmospheric conditions, aerial vehicles are limited with airspace restrictions, mounting issues (engine vibration effects) and requires a good path planning. In addition to this aerial hyperspectral imaging costs per area are higher than satellite imaging but satellites provide high amount of data and downloading and processing these data can be a compelling factor.
Digital Elevation Model (DEM) represents the 3D shape of a terrain in a digital format [2]. The most commonly used methods to obtain digital elevation models are RADAR and LIDAR measurements. Both of RADAR and LIDAR are based on the same principle. They try to calculate flight path of a signal by measuring the flight time. The only difference is while RADAR using electromagnetic waves as a source signal LIDAR uses light (LASER). Both satellites based and airborne solutions offer opportunity to map whole planet without political boundary restrictions.
Hazards
Geological hazards can cause damage to people and cities. Remote sensing technologies can detect the anomalies at certain areas and warn the people before the phenomena occurs. As an example, avalanches and landslides can be pre-determined by using meteorological information and angle of the land or glacier jams can be monitored with thermal imaging and if melting starts population regions can be evacuated at downstream.
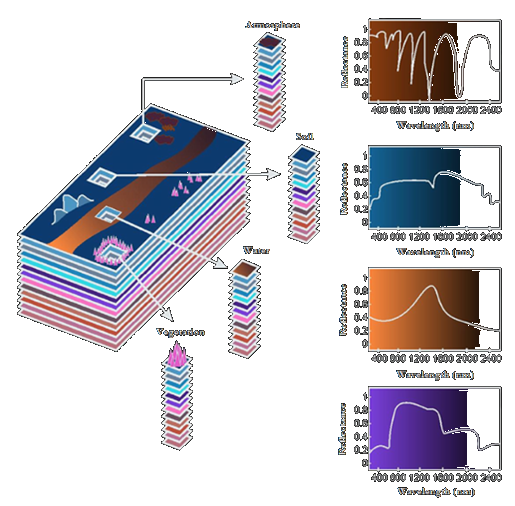
Seismology is a major topic in geology and LIDAR or SAR imaging can locate the seismic faults. In addition to this, similar to seismic surveying, discontinuity regions help the identify faults with geophones. In Figure 3, with a seismic source and geophones the discontinuity regions, this means seismic faults, can be determined easily. Locating the fault zones can help the urban planning for prevent fatal losses at earthquakes and/or tsunamis.
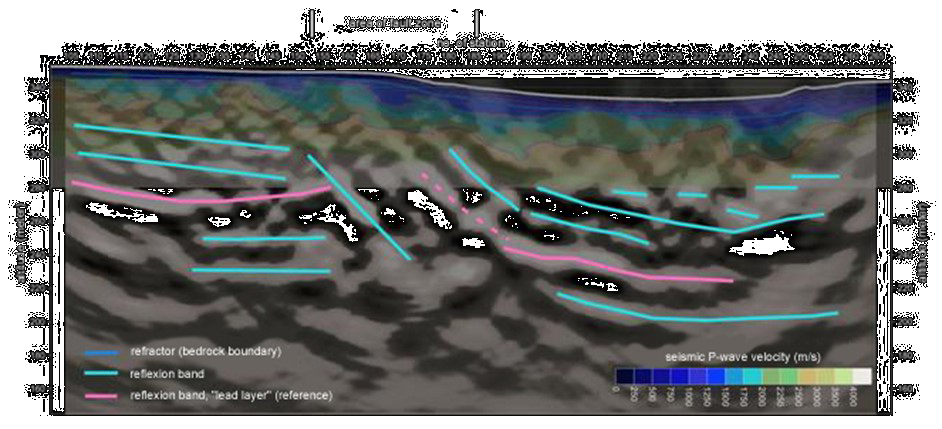
Figure 3. Detected seismic faults with remote sensing (Source: http://www.geofact.de/).
Economic sources
Seismic survey, method of investigating subterranean structure, particularly as related to exploration for petroleum, natural gas, and mineral deposits [3]. With increasing population and decreasing deposits identifying mineral rich zones becomes more important.
Seismic surveying is based on a simple principle. When a wave encounters a discontinuity, it reflects and/or refracts. By listening these returning signals, different segments can be detected. In Figure 4, an illustration of seismic research on a marine environment can be seen. An acoustic source (generally an explosion) emits sound waves. When sound waves hit the seabed most of the waves are reflected, only small amount of waves transmitted to land but the transmitted waves are reflected too when encounters with different sedimentary layers or fossil fuel reservoirs. By filtering and analyzing these waves reservoirs can be mapped.
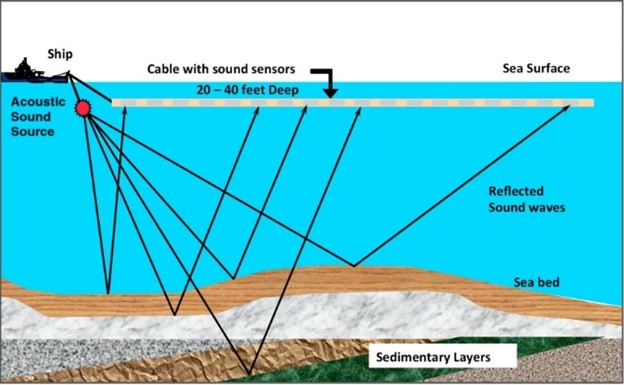
Figure 4. Seismic surveying on a marine environment (Source: https://coastalreview.org/).
In [4], using only a drophammer as a seismic source, iron-oxide mineralization near of Bergslagen, Sweden is detected by measuring wave velocities with geophones.
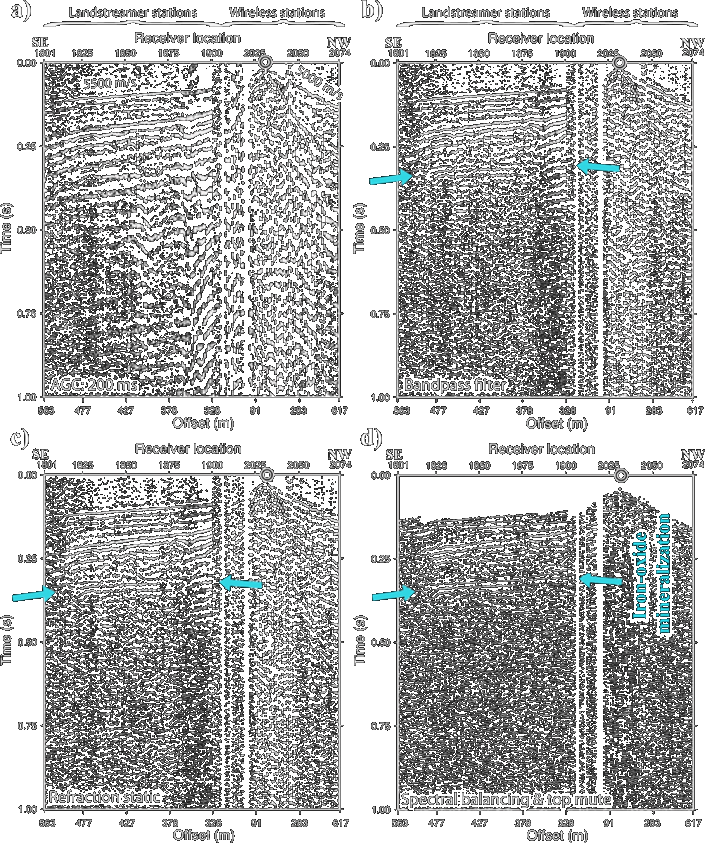
Figure 5. An example of monitoring mineralization near Bergslagen, Sweden [4].
Planetary Observation
Due to the physical limitations of examination of the exoplanets, the remote sensing devices are preferred for studying life elements distribution (carbon, hydrogen, oxygen and nitrogen) or extraterrestrial life on planets different than Earth. Monitoring of pole regions of outer planets and comparing spectral signatures with known minerals can help scientists to determine life potential. Additionally, remote sensing can map elevation of planets and this assist to movements of rovers. For example, elevation map of the Mars can be seen in Figure 6.
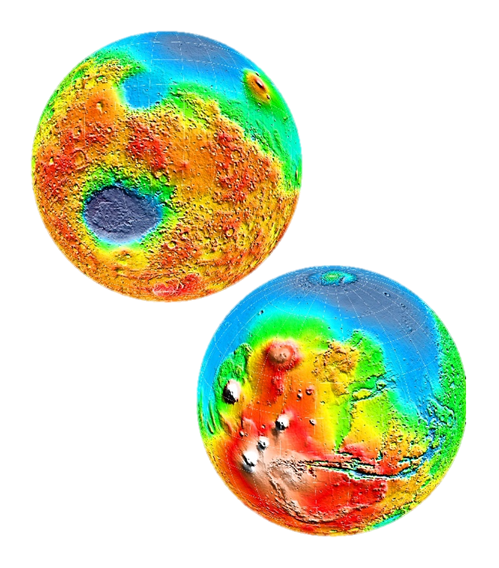
Figure 6. Elevation map of Mars (Source: https://photojournal.jpl.nasa.gov/catalog/PIA02040)
Geographic Information System
Geographic Information System (GIS) is a computer system for capturing, storing, checking, and displaying data related to positions on Earth’s surface [5]. GIS allows researchers to perform spatial analysis on different types of information by visualizing the data. In Figure 7, some of layer types can be seen. Every information type can be defined as a different layer, such as water bodies, buildings, rocks or even gas volumes. So, interaction or relationship between some variables can be determined more easily and faster.
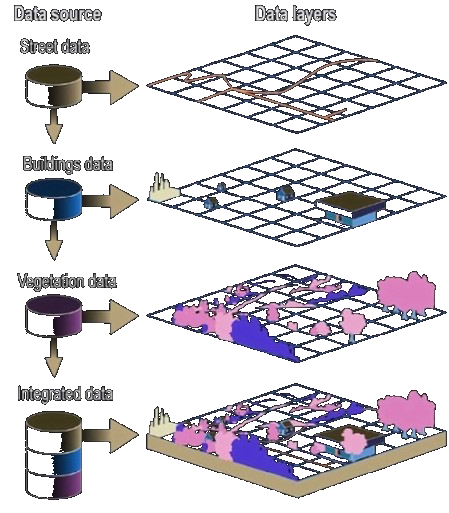
Figure 7. Layers of GIS (Source: https://www.nationalgeographic.org/encyclopedia/geographic-information-system-gis)
- [1] J. W. Harbaugh and B. F. Windley, "Geology," Encyclopædia Britannica, 30 Nisan 2020. [Online]. Available: https://www.britannica.com/science/geology. [Accessed 24 Kasım 2020].
- [2] L. D. Floriani and P. Magillo, "Digital Elevation Models," in Encyclopedia of Database Systems, Springer, 2018.
- [3] T. E. o. E. Britannica, "Seismic survey," Encyclopædia Britannica, 7 November 2017. [Online]. Available: https://www.britannica.com/science/seismic-survey. [Accessed 29 November 2020].
- [4] A. Malehmir, G. Maries, E. Bäckström, M. Schön and P. Marsden, "Developing cost-effective seismic mineral exploration methods using a landstreamer and a drophammer," Science Reports 7, 2017.
- [5] J. Evers, "Geographic Information System," National Geographic, 9 October 2012. [Online]. Available: https://www.nationalgeographic.org/encyclopedia/geographic-information-system-gis/. [Accessed 24 November 2020].